
Benefits
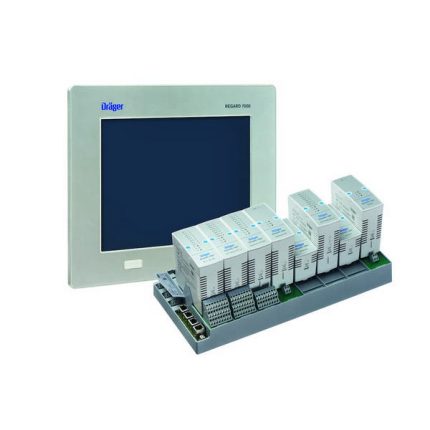
Visualisation of the Dräger REGARD® 7000 control system
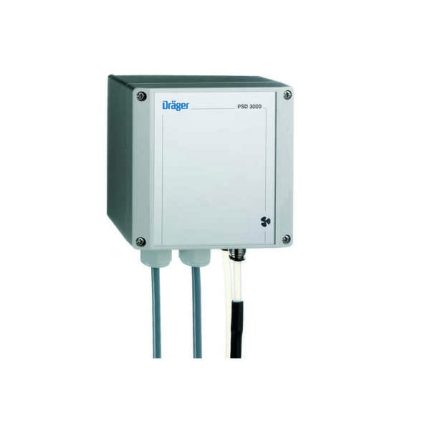
RVP 7000 is a display for the graphical representation of measured values and a trend display of up to 320 inputchannels from a Dräger REGARD® 7000 control system. The RVP 7000 stores readings and events for a period of up to one year (first-in-first-out) in two-second intervals. With the optional web server, you can visualise and operate the Dräger RVP 7000 on up to three remote PCs.
Trend analysis graphics
The trend analysis shows you the progress of measured values for a selected REGARD 7000 channel in a single diagram. This shows you the gas concentrations for a measuring point over the last 365 days. You can also choose between viewing large time periods, like entire months, or just specific hours.
Event logger and event list
Dräger RVP 7000 saves all events, status information and measured values from the input channels for a period of up to 365 days. If you need to, you can retrieve an event list in which the date, time and status of the channels are logged. This list can be saved and printed out for documentation purposes.
Webserver
RVP 7000’s optional web server function enables you to access the visualisation on additional PCs too. Simply launch the application via a web browser and use the software as usual. The visualisation can be accessed by up to three web clients at the same time.